| Dr. Masahiro Miura's Page Department of Ophthalmology Tokyo Medical University, Ibaraki Medical Center |
|||
| Optical Coherence Tomography | |||
| About Miura CV Peer-reviewd paper SLO imaging OCT imaging |
Dr. Miura is collaborating with Computational Optics Group in the University of Tsukuba for the clinical application of optical coherence tomography. This collaboration
study developed following novel imaging technique. |
||
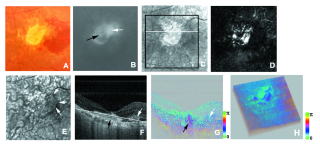 Evaluation of age-related macular degeneration with PS-OCT @ 840 nm Right eye of a 66-year-old male with disciform scar with new exudative lesion. (A) Color fundus photograph. (B) Fluorescein angiography image showed a new CNV (white arrow) adjacent to the disciform scar (black arrow). (C) Average reflectance image of GDx. The black line indicates the area of PS-SD-OCT imaging, and the white line indicates the scanning line of PS-SD-OCT in Figs. 4-7F, 4-7G, and 4-7H. A bright spot on the center of the GDx image was an instrument artifact. (D) Phase retardation map of GDx. (E) Depolarized light image of GDx. The white arrows indicate new CNV. (F) B-scan intensity image of PS-SD-OCT. The white arrow indicates new CNV, and the black arrow indicates disciform scar. The white line indicates the plane for cut-away volume image in Fig. 4-7H. (G) B-scan cumulative phase retardation image. The white arrow indicates new CNV, and the black arrow indicates disciform scar. (H) Cut-away volume image of cumulative phase retardation image. (Miura M, Yamanari M, et al(2008) Imaging polarimetry in age-related macular degeneration. Invest Ophthalmol Vis Sci 49: 2661-2667.) 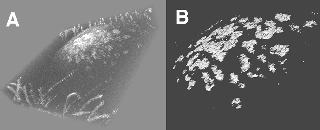 3-D imaging of corneal opacity with OCT @ 1300 nm. (A) Three-dimensional OCT image of the cornea and (B) three-dimensional image of the corneal opacities. The three-dimensional OCT image shows multiple opacities, corresponding to the deposits in the cornea. (Miura M, Mori H, et al(2007) Three-dimensional optical coherence tomography of granular corneal dystrophy. Cornea 26: 373-374) 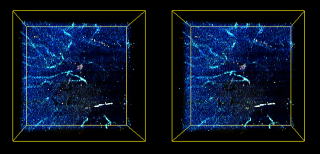 Doppler OCT imaging for polypoidal choroidal vasculopathy A stereoscopic view of the three-dimensional Doppler optical coherence angiography image of an eye affected by polypoidal choroidal vasculopathy. A pair of images is presented for crossed-eye viewing. The distribution of the Doppler signals from the retina, choroid, and the space between the retinal pigment epithelium and Bruch’s membrane are color-coded with white, green, and red, respectively. (Miura M, Makita S, et al (2011) Three-dimensional visualization of ocular vascular pathology by optical coherence angiography in vivo. Invest Ophthalmol Vis Sci. 52:2689-2695) |
|||
| Depatment of Ophthalmology, Tokyo Medical University, Ibaraki Medical Center (in Japanese) |
|||